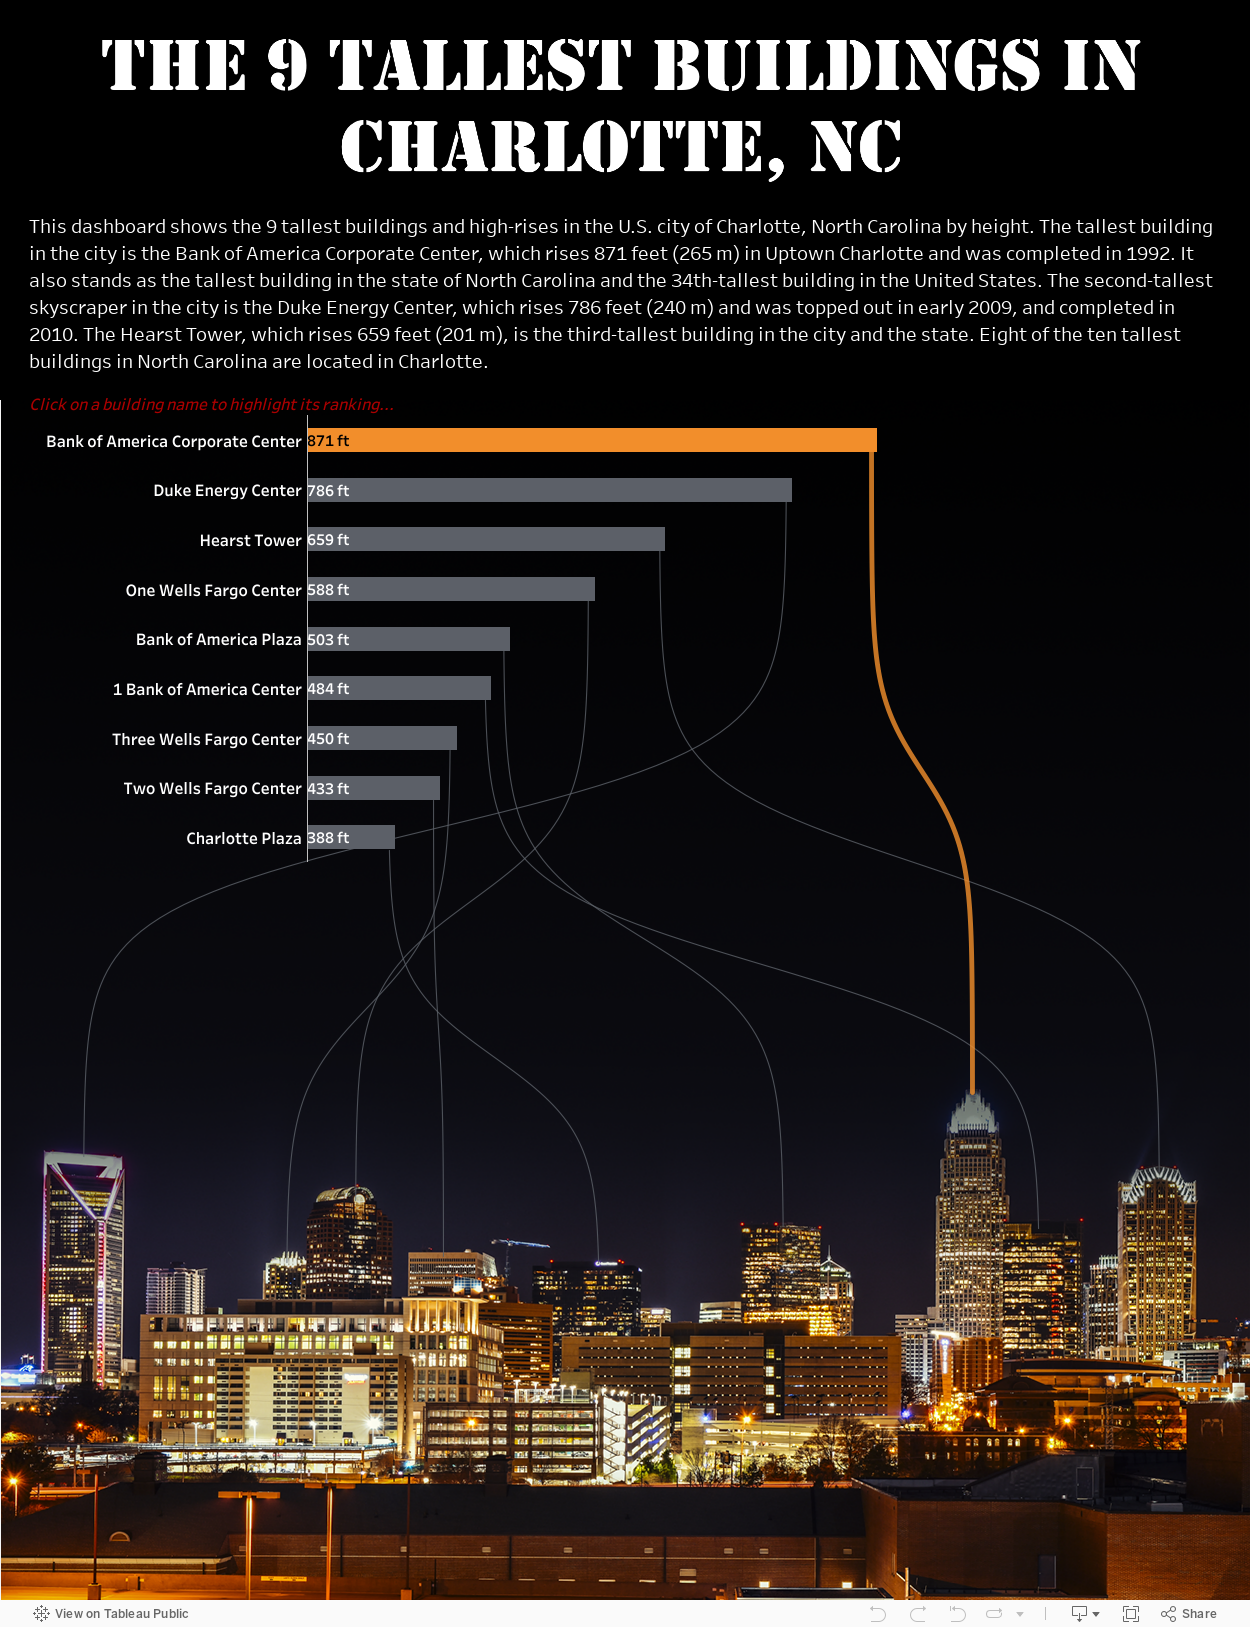
This dashboard shows the 9 tallest buildings and high-rises in the U.S. city of Charlotte, North Carolina by height. It uses data densification and sigmoid curves to draw the lines from the bar charts to the buildings.
Uptown Charlotte Skyscrapers
(This dashboard leverages data densification, sigmoid curves and background image mapping.)
This dashboard shows the 9 tallest buildings and high-rises in the U.S. city of Charlotte, North Carolina by height. It uses data densification and sigmoid curves to draw the lines from the bar charts to the buildings.